Around this time a year ago, President Ángel Cabrera was inaugurated as Mason’s president – marking perhaps the biggest turning point in the university since it became an independent university in 1972.
As Mason begins to go through these changes, it’s important to understand where we stand today and where we’ve come from. In order to do that, we thought we could graph it for you.
1. Yes – Mason is big. And it’ll probably get bigger.
In the fall of 2013, Mason welcomed its largest freshman class in history, marking a trend that has characterized the university for over a decade. The university recently entered into a partnership with a company to boost international student enrollment, and has explained that enrolling more non-Virginia students could help with funding cuts (more on that later).
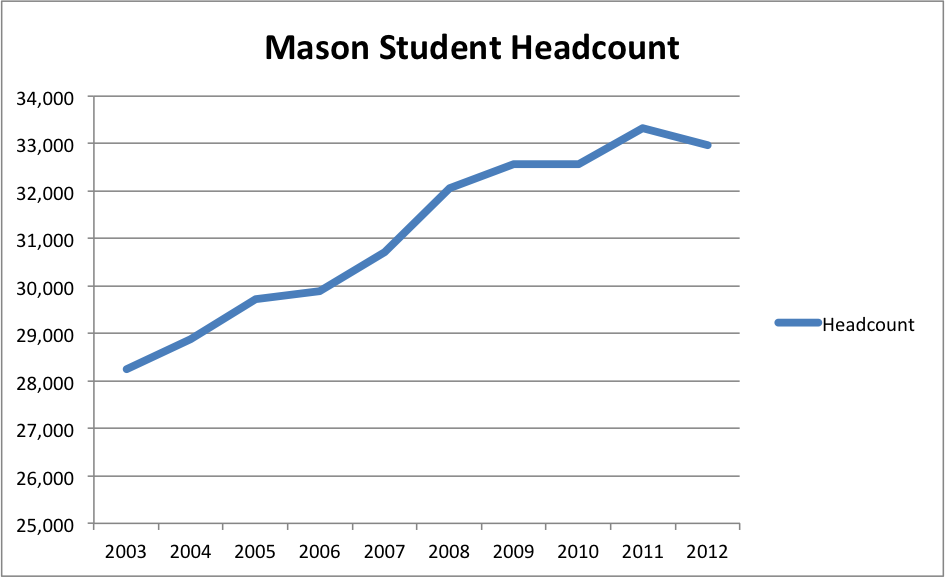
Data provided by Mason Institutional Research & Reporting.
2. Mason is becoming more of a full-time university
One of the biggest assumptions about Mason is that it’s home to non-traditional students — that many of our students are older, part-time, have families, etc. In many ways, that is still true. We enroll more traditionally underrepresented students now more than ever (more on that later), but when it comes to time spent in school, we’re starting to look like a more traditional university.
For the past decade, the number of part-time students at Mason has remained stagnant and started to fall. Meanwhile, full-time students account for all of the enrollment growth in the past few years.
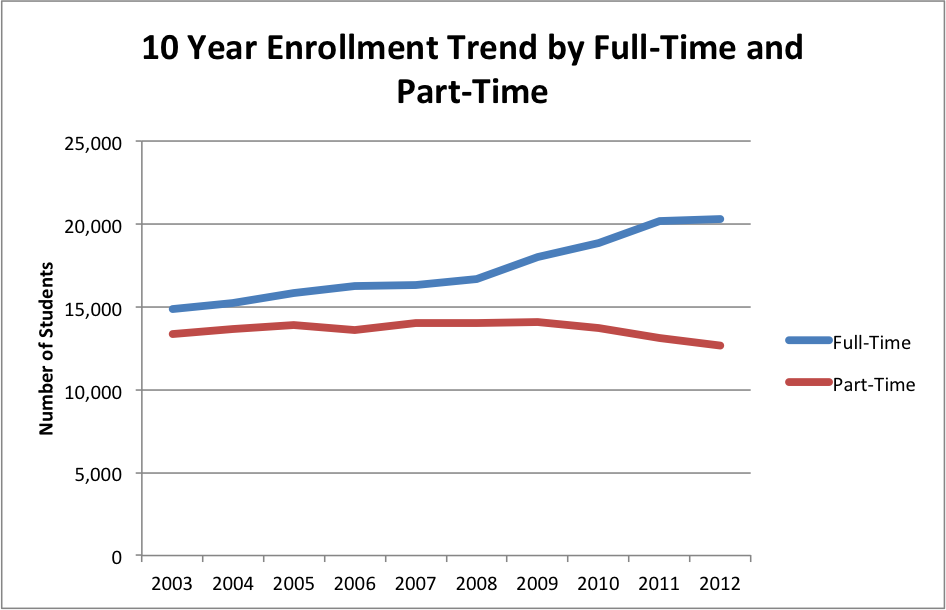
Data provided by Mason’s Institutional Research & Reporting.
3. More out-of-state students are coming to Mason
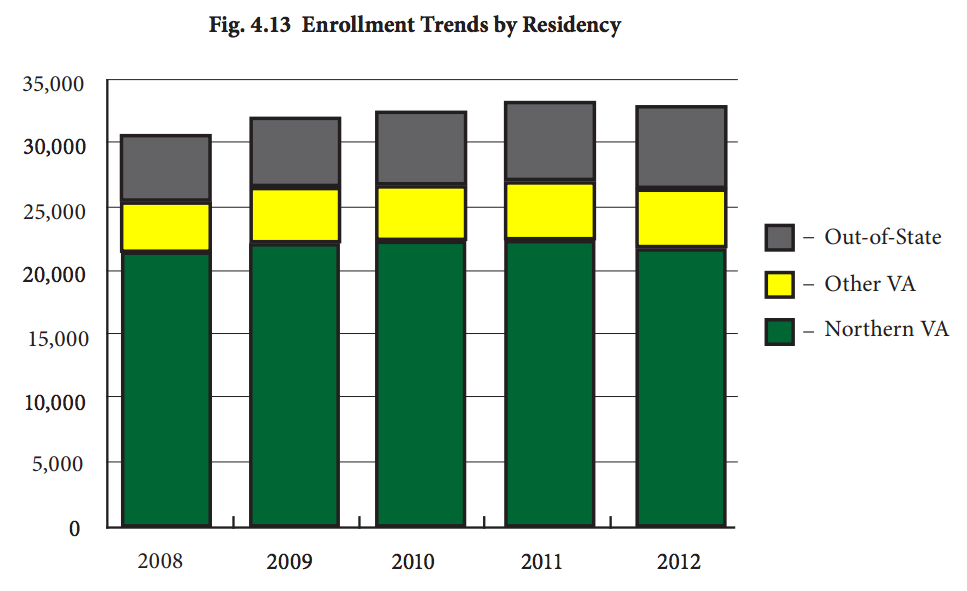
Data provided by Mason’s Institutional Research & Reporting.
4. Mason is enrolling more traditionally underrepresented students from Virginia
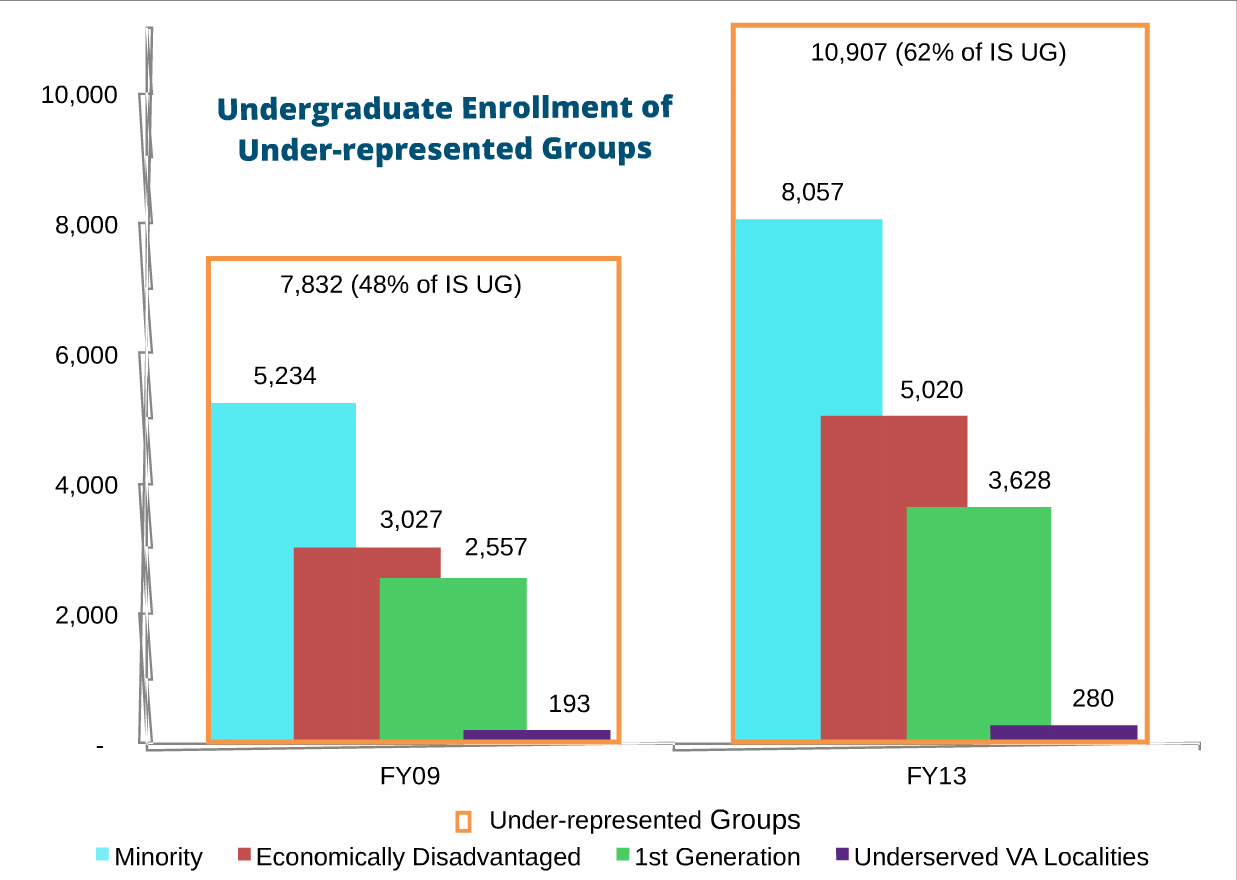
Graph provided by Mason’s Office of Budget & Planning.
5. Tuition is rising
Perhaps the most painfully obvious trend in higher education. This is not unique to Mason.

Graph provided by Mason’s Institutional Research & Reporting.
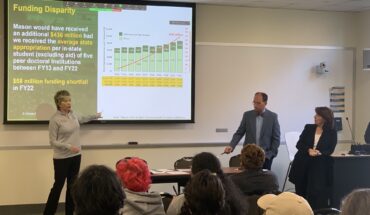
6. Partly because funding from Virginia has dropped
Mason is a public university, which means it receives (or is supposed to receive) funding from Virginia taxpayers. Over time, Mason has had a smaller and smaller amount of its costs covered by state funding, shifting the costs of education onto students.
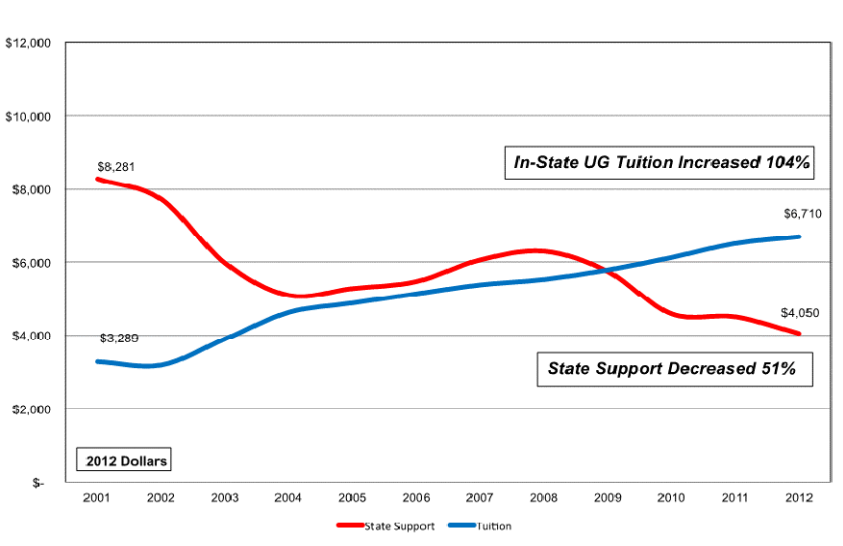
As Mason continues to grow, Virginia has decreased its contribution to the university, which push tuition prices up. (Photo courtesy of Mason’s Office of Budget and Planning.)
7. The cost of education has been shifted onto out-of-state students
But tuition increases have certainly not been equal for all students. Out-of-state students have taken the brunt of Virginia funding cuts.
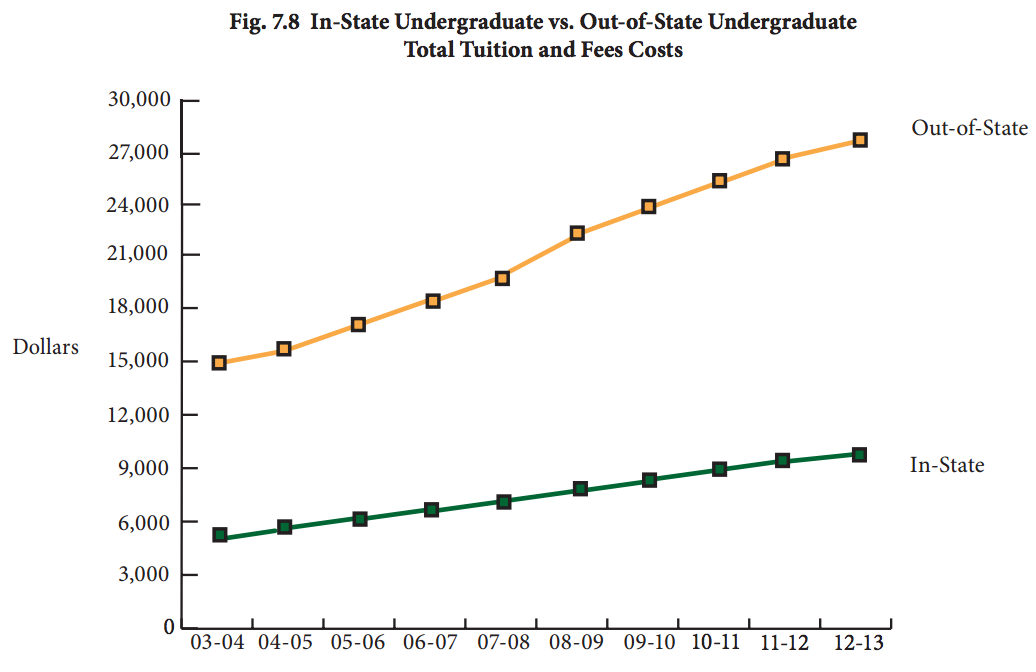
Graph provided by Mason’s Institutional Research & Reporting.
8. That’s starting to have an affect on student debt
The gap in student debt between Virginia students and out-of-state students is starting to grow.
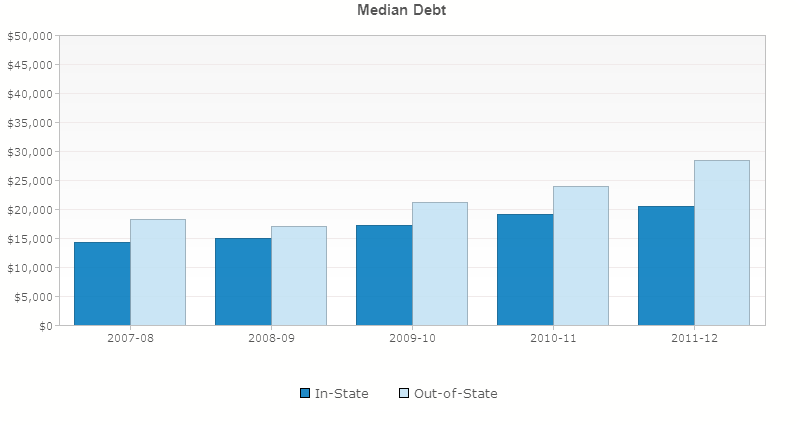
Graph provided by the Virginia State Council of Higher Education.
9. But Mason’s return on investment is still one of the best
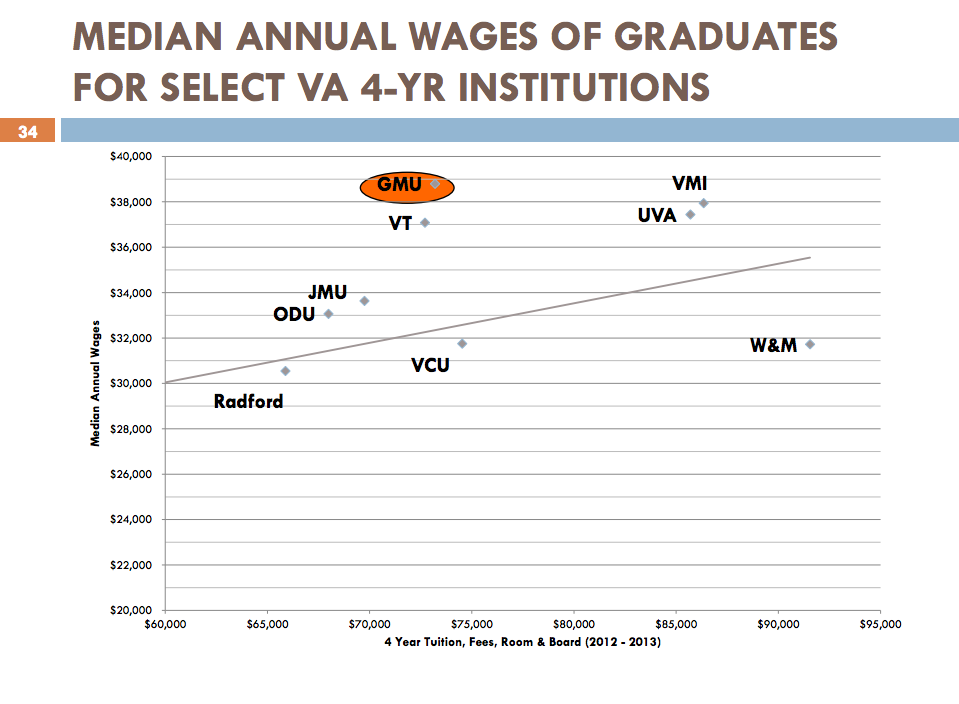
Mason graduates receive the highest median wages out of any other Virginia public four-year institution (graph courtesy of George Mason University Board of Visitors).
10. Mason’s most popular degree is psychology
In Spring 2013, over 450 students in the graduating class graduated with a degree in psychology.

Data provided by Mason’s Institutional Research & Reporting.
11. The Hispanic population at Mason has grown 94 percent in the past 10 years
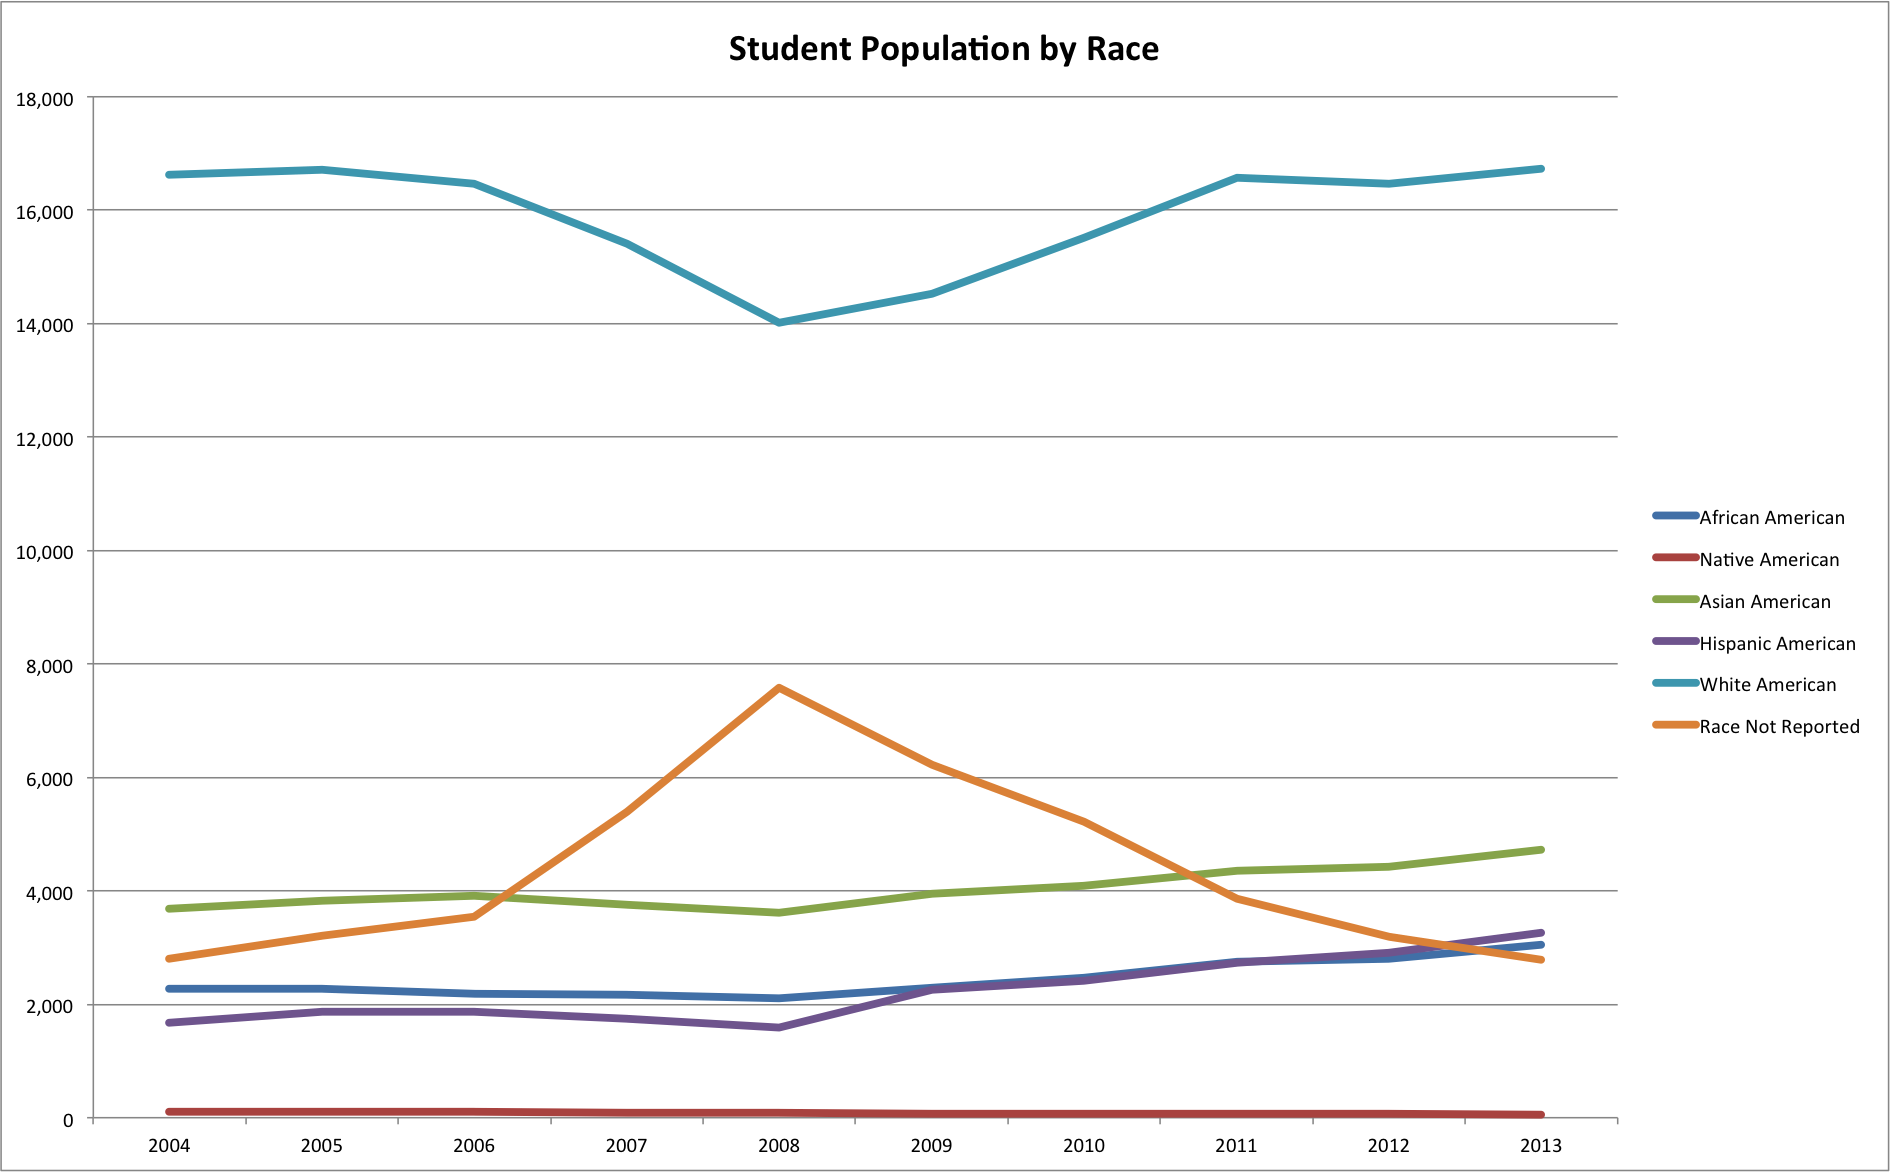
Data provided by Mason’s Institutional Research & Reporting.
12. The sense of belonging at Mason has grown considerably over the past 20 years
Which could be a counter-example to our community problem.

Graph provided by Mason’s Institutional Research & Reporting.